
|
Publishing Policy
Seen through Statistics:
2022.09.05
Seen through statistics: The Status of Offline bookstores in Korea.
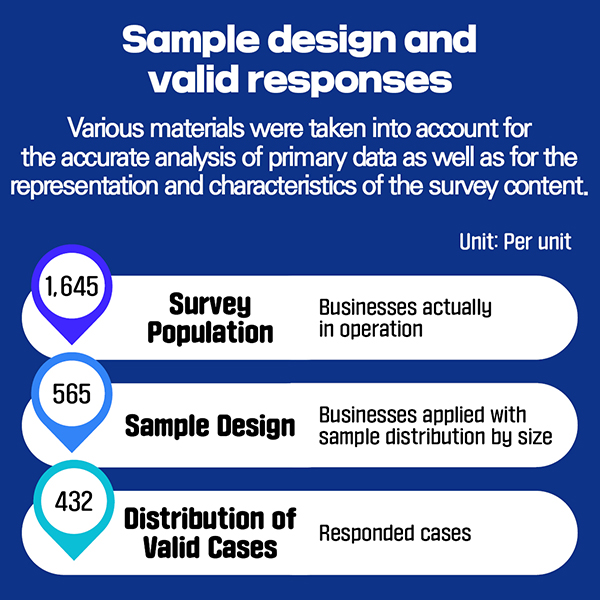
Sample design and valid responses (Unit: Per unit)
Various materials were taken into account for the accurate analysis of primary data as well as for the representation and characteristics of the survey content.
•
Survey Population: 1,645 (Criterion: Businesses actually in operation)
•
Sample Design: 565 (Criterion: Businesses applied with sample distribution by size)
•
Distribution of Valid Cases: 432 (Criterion: Responded cases)
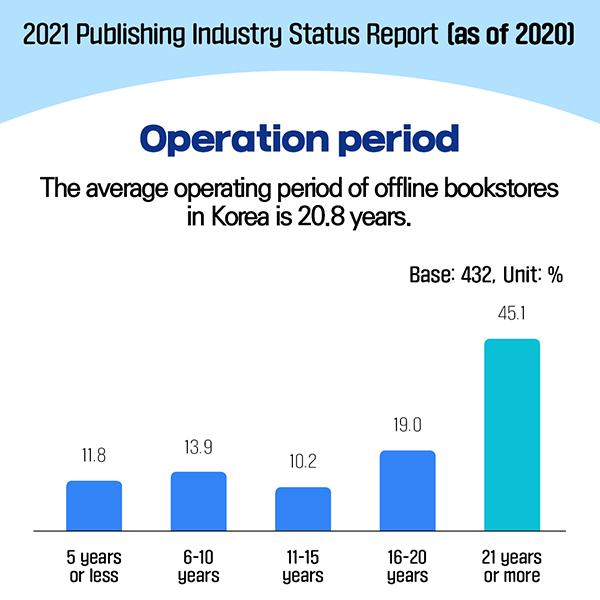
Operation period (Base: 432, Unit: %)
The average operating period of offline bookstores in Korea is 20.8 years.
•
5 years or less 11.8, 6-10 years 13.9, 11-15 years 10.2, 16-20 years 19.0, 21 years or more 45.1
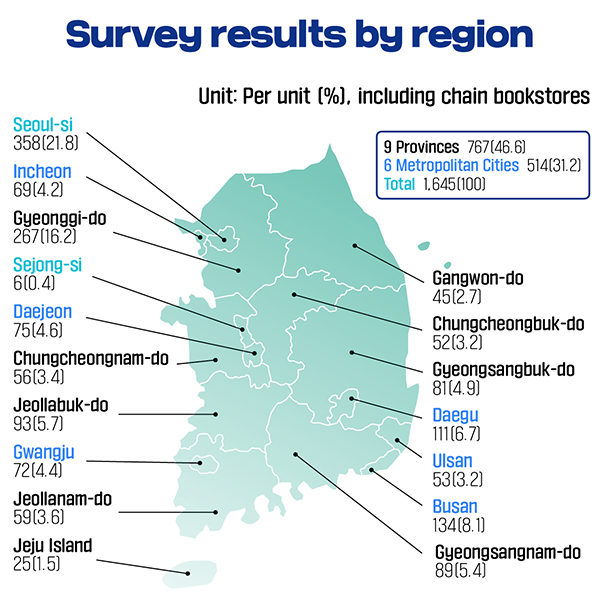
Survey results by region (Unit: Per unit (%), including chain bookstores)
•
Seoul-si: 358 (21.8)
•
6 Metropolitan Cities 514 (31.2): Busan 134 (8.1), Daegu 111 (6.7), Incheon 69 (4.2), Gwangju 72 (4.4), Daejeon 75 (4.6), Ulsan 53 (3.2)
•
Sejong-si: 6 (0.4)
•
9 Provinces 767 (46.6): Gyeonggi-do 267 (16.2), Gangwon-do 45 (2.7), Chungcheongbuk-do 52 (3.2), Chungcheongnam-do 56 (3.4), Jeollabuk-do 93 (5.7), Jeollanam-do 59 (3.6), Gyeongsangbuk-do 81 (4.9), Gyeongsangnam-do 89 (5.4), Jeju Island 25 (1.5)
•
Total: 1,645 (100.0)
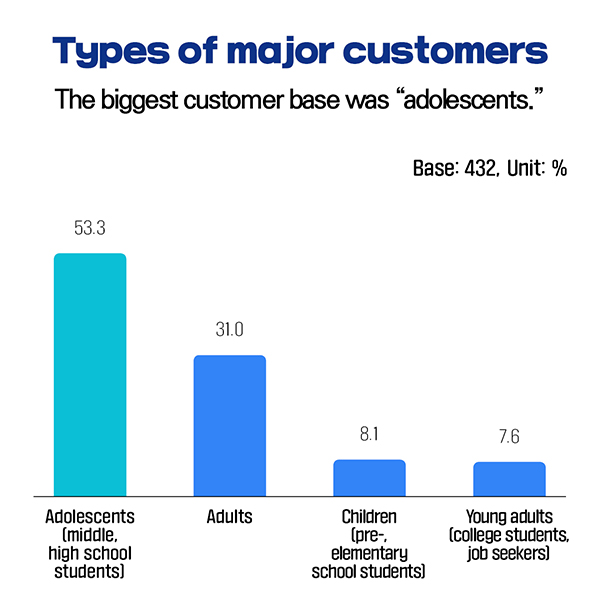
Types of major customers (Base: 432, Unit: %)
The biggest customer base was “adolescents.”
•
Adolescents (middle, high school students) 53.3, Adults 31.0, Children (pre-, elementary school students) 8.1, Young adults (college students, job seekers) 7.6
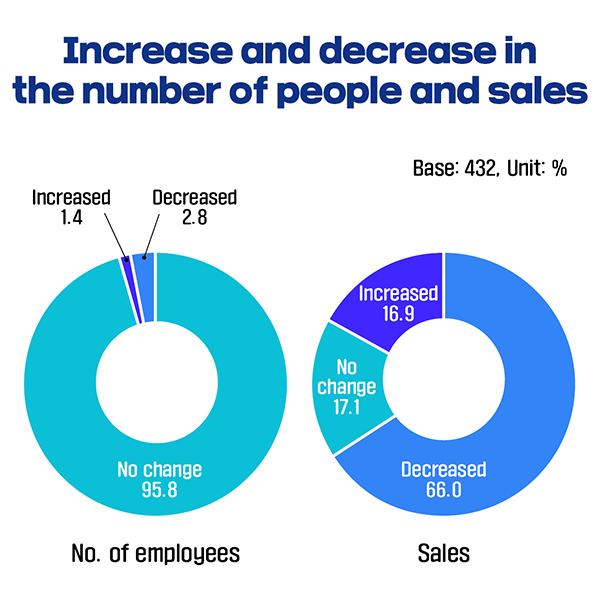
Increase and decrease in the number of people and sales (Base: 432, Unit: %)
•
No. of employees: Increased 1.4, No change 95.8, Decreased 2.8
•
Sales: Increased 16.9, No change 17.1, Decreased 66.0
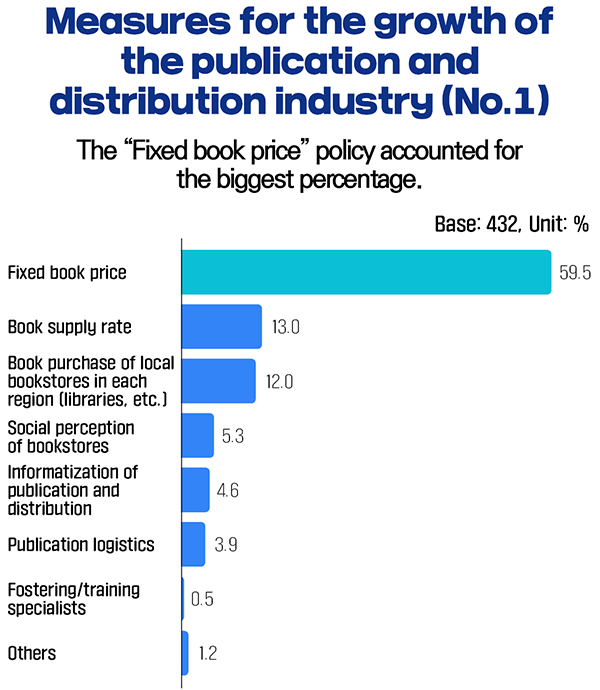
Measures for the growth of the publication and distribution industry (No.1) (Base: 432, Unit: %)
The “Fixed book price” policy accounted for the biggest percentage.
•
Fixed book price 59.5, Book supply rate 13.0, Book purchase of local bookstores in each region (libraries, etc.) 12.0, Social perception of bookstores 5.3, Informatization of publication and distribution 4.6, Publication logistics 3.9, Fostering/training specialists 0.5, Others 1.2
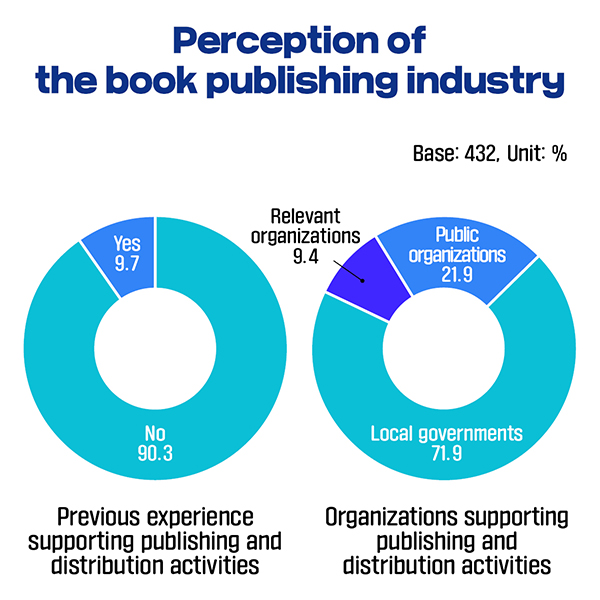
Perception of the book publishing industry (Base: 432, Unit: %)
•
Previous experience supporting publishing and distribution activities: Yes 9.7, No 90.3
•
Organizations supporting publishing and distribution activities: Relevant organizations 9.4, Public organizations 21.9, Local governments 71.9
So, these were the survey results of offline bookstores in 2020. Then, how did the survey in the first half of 2021 turn out, regarding the impact of COVID-19?
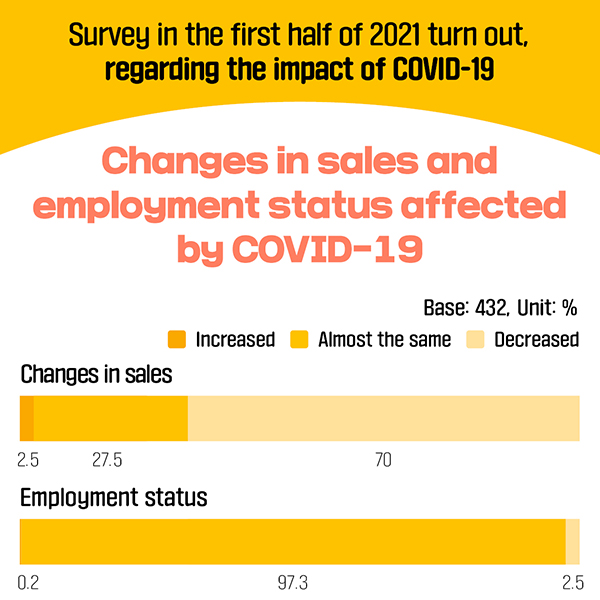
Changes in sales and employment status affected by COVID-19 (Base: 432, Unit: %)
•
Changes in sales: Decreased 70.0, Almost the same 27.5, Increased 2.5
•
Employment status: Decreased 2.5, Almost the same 97.3, Increased 0.2
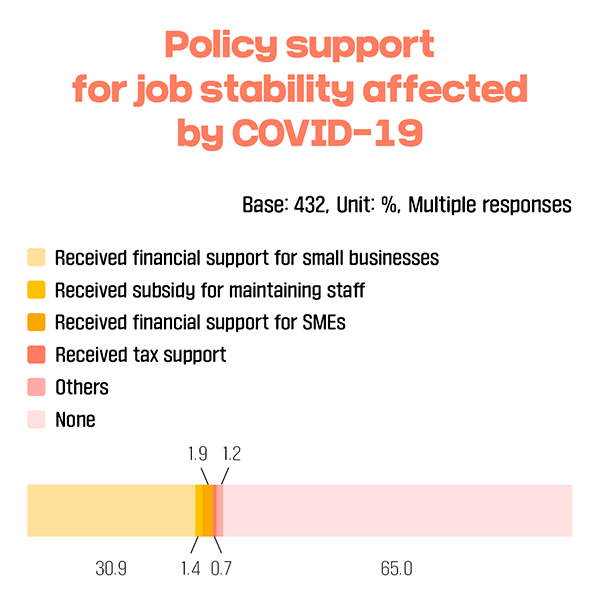
Policy support for job stability affected by COVID-19 (Base: 432, Unit: %, Multiple responses)
•
Received financial support for small businesses 30.9, Received subsidy for maintaining staff 1.4, Received financial support for SMEs 1.9, Received tax support 0.7, Others 1.2, None 65.0
Full details of the “2021 Publishing Industry Status Report (as of 2020)” can be found on the KPIPA website.
#Offline bookstores#Statistics#KPIPA#Publishing Industry Status Report #COVID-19 |

Pre Megazine
-

The Influence and Application of AI Translators on the Publishing Industry and the Import and Export of Copyrights
VOL.69
2024.04 -
Korea is Now All About Plants!
VOL.69
2024.04 -
Korean Literature in the American Market
VOL.69
2024.04 -
The World Grows in the Wait
VOL.69
2024.04 -
Why We Read Fiction
VOL.69
2024.04 -
Recent Status of Korean Webnovels
VOL.69
2024.04 -
How Book Club Platforms Captivate Readers
VOL.68
2024.03 -
For Planet Earth, Where We Coexist
VOL.68
2024.03 -
More and More Chinese Readers Are Starting to Pay Attention to Korean Literature
VOL.68
2024.03 -
Warm Hope in a Cold City
VOL.68
2024.03 -
The Wisdom to Survive in the Ever-changing World
VOL.68
2024.03 -
Publishers and YouTube: Current Status and the Future
VOL.68
2024.03 -
K-Illustrations in One Spot!
VOL.68
2024.03 -
Publishing Strategies Targeting the MZ Generation
VOL.67
2024.02 -
AI is Changing Our Everyday Life
VOL.67
2024.02 -
The Most Korean is the Most Global
VOL.67
2024.02 -
The Jolly Shelter and Home of the Mangwon-dong Brothers!
VOL.67
2024.02 -
Reading: Sorting Out the Unchanging from the Changing
VOL.67
2024.02 -
A Call for an Evolutionary Level of Imagination: Replacement of Dominant Species
VOL.67
2024.02 -
Starting Life With Books, Bookstart Korea
VOL.67
2024.02 -
2023 Publishing Statistics & 2024 Publishing Market Outlook
VOL.66
2024.01 -
2020-2022 Bestsellers: Korean Humanities Books
VOL.66
2024.01 -
Korean Picture Books Today
VOL.66
2024.01 -
Everything About Coffee We Love
VOL.66
2024.01 -
Enjoy the Taste and Scent of Korea With Genre Literature
VOL.66
2024.01 -
The Street of Youth: Shinchon, Seoul
VOL.66
2024.01 -
Time to Dive Into Korean History
VOL.66
2024.01 -
Marketing in Korean Bookstores: Recovered Editions & Book-funding
VOL.65
2023.12 -
2020-2022 Bestsellers: Korean Self-help Books
VOL.65
2023.12 -
Artificial Intelligence (AI) Use Cases in the Korean Publishing Market
VOL.65
2023.12 -
Modern Korean Art
VOL.65
2023.12 -
Successful Publication Cases of Korean Children’s Books in China
VOL.65
2023.12 -
Human Acts, One Step Closer to a Painful Memory
VOL.65
2023.12 -
Endless Possibilities in Korean Science Books and SF
VOL.65
2023.12 -
Korean Libraries’ Various Book-reading Activities and Cooperation Efforts with the Publishing Industry
VOL.64
2023.11 -
2020-2022 Bestsellers: Korean Picture Books
VOL.64
2023.11 -
Legal and Ethical Issues and Implications of AI-based Creations
VOL.64
2023.11 -
The Dwelling Culture of Korea
VOL.64
2023.11 -
Bringing Korean Literature to Hebrew Readers
VOL.64
2023.11 -
Re-creating Pyeongsa-ri from the Book Land
VOL.64
2023.11 -
Living a Life in Korea in 2023
VOL.64
2023.11 -
Bookshelves are Going into TVs!
VOL.63
2023.10 -
2020-2022 Bestsellers: Korean Fiction
VOL.63
2023.10 -
The AI Storm Sweeps the Publishing Industry: Chat GPT
VOL.63
2023.10 -
K-Food Captivates the World
VOL.63
2023.10 -
A Special Convenience Store that Mesmerized Japanese Readers!
VOL.63
2023.10 -
A Place Where You Can Make Unforgettable Memories: Hakuda Photo Studio
VOL.63
2023.10 -
The Women We Don’t Want to Know
VOL.63
2023.10 -
Today and Tomorrow of the Korean Standard Publishing Distribution Data Hub System
VOL.62
2023.09 -
Winning and Nominated Works for International Literary Awards in 2022
VOL.62
2023.09 -
From YouTube to Books
VOL.62
2023.09 -
The Era of Dance is Coming
VOL.62
2023.09 -
Current Status and Prospects of Korean Literature in Arab Countries
VOL.62
2023.09 -
Fly on a Witch’s Vacuum Cleaner: Witches’ Delivery
VOL.62
2023.09 -
Fiction is a Journey Into the Complexity of Human Identity
VOL.62
2023.09 -
Today and Future of Korean Digital Publishing
VOL.61
2023.08 -
Korean Literary Magazines and Literary Webzines
VOL.61
2023.08 -
From the Margins to the Center: Korean Mystery Literature
VOL.61
2023.08 -
K-pop and the World!
VOL.61
2023.08 -
Mexican Readers and Korean Literature
VOL.61
2023.08 -
Where the Children from the Book Children of Kwaeng-I-Bu-Ri Village Used to Play
VOL.61
2023.08 -
Radio DJ’s Pick
VOL.61
2023.08 -
The 2023 Seoul International Book Fair and the K-Book Copyright Market
VOL.60
2023.07 -
Book Pricing Strategies in Korea
VOL.60
2023.07 -
Translation and Publication Support Projects in Korea
VOL.60
2023.07 -
My Brilliant Life
VOL.60
2023.07 -
Bringing Hwang Sun-Mi books to Türkçe Readers
VOL.60
2023.07 -
Hahn Moo-Sook House
VOL.60
2023.07 -
Professor of Korean Language and Literature & Literary Critic’s Pick
VOL.60
2023.07 -
The Trend and Prospects of the Self-help Book Market in Korea
VOL.59
2023.06 -
E-Book Platforms in Korea
VOL.59
2023.06 -
Travelers Return After COVID-19
VOL.59
2023.06 -
Divorce Attorney Shin
VOL.59
2023.06 -
The Marketing Strategy for the Chinese Version of The Mummy Book
VOL.59
2023.06 -
The Library of Mystery Literature
VOL.59
2023.06 -
Japanese Translator’s Pick
VOL.59
2023.06 -
Reader-friendly Publication Marketing
VOL.58
2023.05 -
2023 K-Book Copyright Market & Seoul International Book Fair
VOL.58
2023.05 -
The Current and Future Ecosystem of Published Comics
VOL.58
2023.05 -
D.P.
VOL.58
2023.05 -
Flowers of the Orient – Bringing Korean Gems to Polish Readers
VOL.58
2023.05 -
Chaeg Bar
VOL.58
2023.05 -
Korean Theatre Director’s Pick
VOL.58
2023.05 -
Domestic Video Content Originating from Literature
VOL.57
2023.04 -
Paju Bookcity
VOL.57
2023.04 -
“Restructuring of Family” Becoming Inevitable
VOL.57
2023.04 -
Reborn Rich
VOL.57
2023.04 -
The Uncanny Convenience Store’s Magical Journey in Taiwan
VOL.57
2023.04 -
Sehan Bookstore
VOL.57
2023.04 -
Singer-Songwriter’s Pick
VOL.57
2023.04 -
How are Regional Publishers in Korea Thriving?
VOL.56
2023.03 -
KPIPA hosts the 2023 Visiting Korean Book Fair
VOL.56
2023.03 -
Export Status of Korean Webnovels and Webtoons
VOL.56
2023.03 -
Namhansanseong Fortress
VOL.56
2023.03 -
Korean Books Published by Haru Publisher Indonesia
VOL.56
2023.03 -
Book Plant
VOL.56
2023.03 -
Illustrator’s Pick
VOL.56
2023.03 -
“PDF/POD” - Korean Publishing Market Develop into Diverse Formats
VOL.55
2023.02 -
Arts Council Korea’s Munhak Nanum Book Distribution Project
VOL.55
2023.02 -
The Future of Korean Novels: Gen-MZ Writers
VOL.55
2023.02 -
Diary of a Murderer
VOL.55
2023.02 -
Successful Import Case of Korean Literature in the U.S.A.
VOL.55
2023.02 -
Chosochaekbang
VOL.55
2023.02 -
Museum Curator’s Pick
VOL.55
2023.02 -
New Approaches to Education in the Korean Publishing Industry
VOL.54
2023.01 -
Where Writers and Readers Meet
VOL.54
2023.01 -
The “Most Korean” Features Penetrate the World
VOL.54
2023.01 -
International Human Rights Expert, Professor Chung Chin-Sung
VOL.54
2023.01 -
Korean Books Published in Thailand through Nanmeebooks
VOL.54
2023.01 -
Namsan Public Library
VOL.54
2023.01 -
Elementary School Teacher’s Pick
VOL.54
2023.01 -
“Trend Forecasters” Dominate Bookstores in Korea
VOL.53
2022.12 -
Art Critic Professor Yu Hong-June
VOL.53
2022.12 -
Korean and Japanese Publishers Join Hands
VOL.53
2022.12 -
Seoul Metropolitan Library
VOL.53
2022.12 -
Korean Editor’s Pick
VOL.53
2022.12 -
Current Employment Status in the Korean Publication Industry
VOL.53
2022.12 -
The Gates to K-Books
VOL.53
2022.12 -
Korean Bookstores Dominated by Screenplays and scripts
VOL.52
2022.11 -
Cultural Anthropologist, Professor Chohan Haejoang
VOL.52
2022.11 -
K-Book Trend in Latin America Seen Through the Chilean Publishing Market
VOL.52
2022.11 -
Jeongdok Public Library
VOL.52
2022.11 -
Former Newscaster and YouTube Creator’s Pick
VOL.52
2022.11 -
MCST Announces the 2022-2026 Publishing Industry Promotion Plan
VOL.52
2022.11 -
Publishers’ Book Clubs
VOL.52
2022.11 -
The “Healing Fiction” Fever
VOL.51
2022.10 -
Professor Kim Ho-Dong, the World-Renowned Scholar in Central Eurasian History
VOL.51
2022.10 -
Foreign Agency on Publishing K-Books in Other Countries in Cooperation with Korean Agency
VOL.51
2022.10 -
NaeRule Gunaseo Supuro Library (Stream & Forest Library)
VOL.51
2022.10 -
A Diplomat’s Pick
VOL.51
2022.10 -
Achievements of the “One City, One Book” Movement
VOL.51
2022.10 -
Breathing Life Into Letters: Unique Hangeul Fonts
VOL.51
2022.10 -
The Adoption of the Public Lending Right, Requiring the Agreement of All Parties in the Publishing Industry
VOL.50
2022.09 -
Seen through Statistics: The Status of Offline Bookstores in Korea
VOL.50
2022.09 -
Fandom and Publishing
VOL.50
2022.09 -
Oh Kang-Nam, Professor of Comparative Religion
VOL.50
2022.09 -
Successful Import Case of Korean Literature in the U.K.
VOL.50
2022.09 -
Banyawol Station Building Small Library and Dongchon Station Building Small Library
VOL.50
2022.09 -
Copyright Agent’s Pick
VOL.50
2022.09 -
Trends in the Publishing Market in the First Half of 2022
VOL.49
2022.08 -
Audiobook Platforms in Korea
VOL.49
2022.08 -
Looking Back on the 65th Seoul International Book Fair in 2022
VOL.49
2022.08 -
Dr. Kim Myung-Ja
VOL.49
2022.08 -
Book Trend in Korea Eyed by the Russian Publishing Market in the 2020s
VOL.49
2022.08 -
“Lotus in the Library” in Jeonju
VOL.49
2022.08 -
Travel Bookstore’s Pick
VOL.49
2022.08 -
Various Book Festivals in Korea
VOL.48
2022.07 -
Promoting La Torre and Korean Literature in Italy
VOL.48
2022.07 -
Publishing Industry Full of Consolation and Sympathy in the Post-COVID-19 Era
VOL.48
2022.07 -
Public Health Specialist and Socialist, Professor Kim Seung-Sup
VOL.48
2022.07 -
Uijeongbu Music Library
VOL.48
2022.07 -
Foreigner Living in Korea’s Pick
VOL.48
2022.07 -
Korea’s Writing Platforms
VOL.48
2022.07 -
On the 100th Anniversary of Children’s Day, How Did the Korean Publishing Industry Spend the Day?
VOL.47
2022.06 -
103-Year-Old Philosopher Kim Hyung-Seok
VOL.47
2022.06 -
12 Years of Publishing Korean Books in Vietnam
VOL.47
2022.06 -
The Factory of Contemporary Arts in Palbok, Poplar Tree Picture Book Library
VOL.47
2022.06 -
A Korean Literary Translator’s Pick
VOL.47
2022.06 -
The Vulnerability of Production Focused on Paper Books
VOL.47
2022.06 -
Seoul Book Institute (SBI)
VOL.47
2022.06 -
Korea’s Publishing Trend - The World Literature Complete Collection
VOL.46
2022.05 -
Types of Korean Magazines based on Keywords
VOL.46
2022.05 -
Newsletter of Korean Publishers
VOL.46
2022.05 -
Brain Engineer Jeong Jae-Seung Seeks Innovative Disciplinary Convergence
VOL.46
2022.05 -
Dollagoot Dream Department Store in the Taiwanese Publishing Market
VOL.46
2022.05 -
Goyang Aram Nuri Library
VOL.46
2022.05 -
Secondhand Bookstore Manager’s Pick
VOL.46
2022.05 -
Korean Book Publishers Eye Webnovels and Webtoons
VOL.45
2022.04 -
Korean Book Designer’s Pick
VOL.45
2022.04 -
A Retirement-encouraging Society in the Era of a 100-year Life Expectancy
VOL.45
2022.04 -
2022 Hans Christian Andersen Award Winner Suzy Lee's Books
VOL.45
2022.04 -
Professor Lim Jie-Hyun’s Realistic and Reflective View on Korean History
VOL.45
2022.04 -
K-BOOK Import Case in Germany
VOL.45
2022.04 -
Gangseo Miracle Library, Busan
VOL.45
2022.04 -
PLATFORM P
VOL.45
2022.04 -
The Comeback of Best-selling Books is Thanks to Youtube
VOL.44
2022.03 -
The Era of the Metaverse: Will It Allow Authors and the Publishing Industry to Coexist?
VOL.44
2022.03 -
2022 Overseas Publication Grants
VOL.44
2022.03 -
The Warmth of Science and Life by Professor Choi Jae-Cheon
VOL.44
2022.03 -
Successful Import Case of Korean Literature in Japan
VOL.44
2022.03 -
Anyang Pavilion (Books on Contemporary Public Art)
VOL.44
2022.03 -
Music Braille Transcriber’s Pick
VOL.44
2022.03 -
“Illness Narratives” A Detailed Reflection of our Society
VOL.43
2022.02 -
Deep Insights into the World from the Great Scholar Lee O-Young’s Viewpoint
VOL.43
2022.02 -
China Export Case
VOL.43
2022.02 -
Art Library Of Uijeongbu
VOL.43
2022.02 -
Korean Food Critic’s Pick
VOL.43
2022.02 -
Collaboration of Reading Class at School and the Publishing Industry
VOL.43
2022.02 -
K-Literature: The Winners of Major International Literary Awards in 2021
VOL.43
2022.02 -
The Korean Book Importing Success Story of AST, a Russian Publisher
VOL.42
2022.01 -
K-Book Promotion and Exchange Event
VOL.42
2022.01 -
Korean Publishing Industry's Crisis and Its Future
VOL.42
2022.01 -
Korean Publishing Industry Current Trends in 2021 and Projections in 2022
VOL.42
2022.01 -
The Life of Dr. Park Moon-Ho and the Journey to Finding the Origin of Thought
VOL.42
2022.01 -
Pohang, Gyeongsangbuk-do
VOL.42
2022.01 -
Movie Critic’s Pick
VOL.42
2022.01 -
Reviews, Review Journals, and the New Review Culture
VOL.41
2021.12 -
Korean Books Seen From a Foreign Blog’s View
VOL.41
2021.12 -
Current Status of Publications for Seniors in Korea
VOL.41
2021.12 -
A Genre for All Generations: Young Adult
VOL.41
2021.12 -
Marketing Strategies for Lane 5 in the Taiwanese Publishing Market
VOL.41
2021.12 -
Wonju, Gangwon-do
VOL.41
2021.12 -
Korean Novelist’s Pick
VOL.41
2021.12 -
A Diagnosis of South Korea's E-book Market Amid Subscription Competition
VOL.12
2019.06 -
The History and Characteristics of South Korean Copyright Legislation
VOL.12
2019.06 -
Nami Island International Children's Book Festival 2019
VOL.12
2019.06 -
The Growth of Korean Audio Books, Celebrities Attract Listeners
VOL.12
2019.06 -
KL Management's Export Success Case for Novel Almond
VOL.12
2019.06 -
The City of Islands and Stories,Tongyeong of South Gyeongsang Province
VOL.12
2019.06 -
Sales of key South Korean bookstores
VOL.13
2019.07 -
South Korea’s Key Publishing Related Organizations
VOL.13
2019.07 -
By Embracing History and Culture, Incheon Blossoms with Literature
VOL.13
2019.07 -
How Eduwill successfully exported the PERFECT TOPIK series to China and Taiwan
VOL.13
2019.07 -
Essays that touch the heart
VOL.13
2019.07 -
2019 Seoul International Book Fair - Arrival
VOL.13
2019.07 -
South Korea's Global Book Exports
VOL.14
2019.08 -
South Korea's Standard Publishing Contracts and Adaptation Rights
VOL.14
2019.08 -
South Korea's Fixed Book Price Policy
VOL.14
2019.08 -
South Korea's Publishing Industry in H1 2019 and Forecasts for H2
VOL.14
2019.08 -
North Korea Seen Through Books, and the Unification of the Korean Peninsula
VOL.14
2019.08 -
South Korea's National Institute of Ecology - Known for publishing content acclaimed worldwide
VOL.14
2019.08 -
Hongdae, a neighborhood with a free and unique culture
VOL.14
2019.08 -
Discussions on public lending rights and tasks ahead
VOL.15
2019.09 -
Social media, or word-of-mouth marketing a must-have for one-person publishing companies
VOL.15
2019.09 -
Busan
VOL.15
2019.09 -
e-future, a business specializing in ELT content
VOL.15
2019.09 -
K-Book in Berlin
VOL.15
2019.09 -
South Korean web novels become a trend of their own
VOL.15
2019.09 -
Visual adaptation rights for books and sales
VOL.16
2019.10 -
South Korea's Imprint System in Publishing
VOL.16
2019.10 -
Paju Book City
VOL.16
2019.10 -
Round Ground
VOL.16
2019.10 -
Books recommended by bookstore MDs and librarians
VOL.16
2019.10 -
Great places to meet South Korean books
VOL.16
2019.10 -
Literary Awards of Korea
VOL.40
2021.11 -
The Current State of Korea’s Libraries and Their Relation to the Publishing Industry
VOL.40
2021.11 -
TV Producer’s Pick
VOL.40
2021.11 -
Cheongju, Chungcheongbuk-do
VOL.40
2021.11 -
Success Stories of Japanese Publisher Kobunsha – Importer of Korean Books
VOL.40
2021.11 -
Advanced Korea: Finding the Right Path for Society
VOL.40
2021.11 -
Book Communities Create a New Cradle for Readers
VOL.40
2021.11 -
Discussions on introducing typographical copyright in South Korea
VOL.17
2019.11 -
South Korea's policies to promote reading and reading movements
VOL.17
2019.11 -
A New Joy Found in Daejeon - Tiny Bookstores
VOL.17
2019.11 -
Published in more than 40 countries, an unprecedented achievement in Korean literature
VOL.17
2019.11 -
Books and Writers of the Year Selected by Bookstores
VOL.17
2019.11 -
South Korean Books at International Book Fairs in 2019
VOL.17
2019.11 -
South Korea's publishing market and distribution structure
VOL.18
2019.12 -
South Korea's publishing market based on category
VOL.18
2019.12 -
Seoul's Tongin-dong
VOL.18
2019.12 -
Hwang Sun-mi, Author of The Hen Who Dreamed She Could Fly
VOL.18
2019.12 -
South Korea's literary awards and competitions of 2019
VOL.18
2019.12 -
South Korea's online platforms where readers can meet genre literature
VOL.18
2019.12 -
2020 Overseas Publication Grants
VOL.19
2020.02 -
Current status of each field in the Korean publishing market ① Literature publication
VOL.19
2020.02 -
Suwon Independent Bookstores
VOL.19
2020.02 -
2019 Korean Novels that fascinated foreign readers
VOL.19
2020.02 -
Writer of the Year Award
VOL.19
2020.02 -
2020 Publication Trends in Korea
VOL.19
2020.02 -
International Exchange Grants
VOL.20
2020.03 -
Current status of each field in the Korean publishing market ② History Publication
VOL.20
2020.03 -
Fly High: Independent Bookstores near the Gimpo International Airport
VOL.20
2020.03 -
Korean Non-Fiction in the Southeast Asian Publishing Market
VOL.20
2020.03 -
Spring Literary Contests held by Newspapers
VOL.20
2020.03 -
Speech and Literature were the weapons of women
VOL.20
2020.03 -
Korea Foundation (KF) Publication Support Program
VOL.21
2020.04 -
Current status of each field in the Korean publishing market ③ Philosophical and Religious Publications
VOL.21
2020.04 -
The future of bookstores seen in GyeongJu
VOL.21
2020.04 -
Korean Children, Young People’s Literature
VOL.21
2020.04 -
Korea’s Flagship Literary Awards for Poems
VOL.21
2020.04 -
Books and Book Clubs
VOL.21
2020.04 -
Korea’s Literary Magazines
VOL.39
2021.10 -
The Current State of Subscription-Based Services of Korea’s Published Content
VOL.39
2021.10 -
Book-tuber’s Picks
VOL.39
2021.10 -
Gumi, Gyeongsangbuk-do
VOL.39
2021.10 -
Many Different Genres of Korean Novels Are Now Selling Abroad
VOL.39
2021.10 -
Food for Thought on Careers, Truthfully Portrayed in Essays
VOL.39
2021.10 -
Observing the Stature of K-Literature Through Foreign Literary Awards
VOL.39
2021.10 -
Facilitation of Sub-rights and Their Markets
VOL.38
2021.09 -
Essay Writer’s Picks
VOL.38
2021.09 -
Gangneung, Gangwon-do
VOL.38
2021.09 -
Korean Literary Works that Have Recently Made Their Debut in France
VOL.38
2021.09 -
K-Fantasy
VOL.38
2021.09 -
The MZ Generation Reads New Non-Fiction
VOL.38
2021.09 -
KAMS Publishing Korean Art : Overseas Publication Support Program
VOL.22
2020.05 -
Current status of each field in the Korean publishing market ④ Social Science Publications
VOL.22
2020.05 -
Songpa, Seoul
VOL.22
2020.05 -
Korean literature spreading across the world
VOL.22
2020.05 -
Korea’s Diverse Children’s Literature Awards
VOL.22
2020.05 -
The Creative World of Baek Heena
VOL.22
2020.05 -
E-book Platforms and the Meaning of “Original Content”
VOL.22
2020.05 -
Overseas Publication Grants 2020
VOL.23
2020.06 -
Current status of each field in the Korean publishing market ⑤ Science & Technology Publications
VOL.23
2020.06 -
Chuncheon
VOL.23
2020.06 -
Export Trend of Self-Development Books in Korea
VOL.23
2020.06 -
Literary Awards and Contests in the field of Genre Literature
VOL.23
2020.06 -
Why K-Books are drawing attention from across the world
VOL.23
2020.06 -
Integrated K-Book Platform
VOL.24
2020.07 -
Current status of each field in the Korean publishing market ⑥ Self-Development Publications
VOL.24
2020.07 -
Jeonju, Jeollabukdo
VOL.24
2020.07 -
Korean Books Sought by Chinese Readers
VOL.24
2020.07 -
K-Sports
VOL.24
2020.07 -
Publication Industry’s Response to the COVID-19 Pandemic
VOL.24
2020.07 -
Current Status of the Korean Standard Publishing Distribution Data Hub System (BookNet Korea)
VOL.37
2021.08 -
BookTuber’s Pick: A Book-to-Read During Summer Vacation
VOL.37
2021.08 -
Dangjin, Chungcheongnam-do
VOL.37
2021.08 -
Korean Books Loved by German Readers
VOL.37
2021.08 -
Protect the Ecosystem and Environment with Books
VOL.37
2021.08 -
2021 Seoul International Book Fair (SIBF)
VOL.37
2021.08 -
Online Business Meeting for the Copyright Import of K-Books
VOL.25
2020.08 -
Current status of each field in the Korean publishing market ⑦ Publication of practical books for home
VOL.25
2020.08 -
Sokcho, Gangwondo Province
VOL.25
2020.08 -
Popular Books in the Overseas Market: Second Half of 2020
VOL.25
2020.08 -
K-Movie
VOL.25
2020.08 -
Books with Discourses on the Post-COVID-19 Era in Korea
VOL.25
2020.08 -
The publications magazines of Korea
VOL.26
2020.09 -
Current status of each field in the Korean publishing market ⑧ Publication of practical books for social activities
VOL.26
2020.09 -
Book-Stay, a Romantic Night with Books
VOL.26
2020.09 -
Second half of 2020 looks promising for Korean publishing industry
VOL.26
2020.09 -
K-Food
VOL.26
2020.09 -
Domestic Exhibition of Korean books for children & teenagers for the 2020 Moscow International Book Fair
VOL.26
2020.09 -
2018 Publication Industry Factual Survey
VOL.27
2020.10 -
Current status of each field in the Korean publishing market ⑨ Publication of Comics and Art
VOL.27
2020.10 -
Jeju Island
VOL.27
2020.10 -
Korea’s Non-Fiction Books Building Global Competitiveness
VOL.27
2020.10 -
K-Beauty
VOL.27
2020.10 -
Background and Prospect of General Revision of Copyright Law in Korea
VOL.27
2020.10 -
Book Funds and Publication
VOL.36
2021.07 -
BookTuber’s Pick: A Book to Chill Your Summer
VOL.36
2021.07 -
Gimpo, Gyeonggi-do
VOL.36
2021.07 -
The Korean Book Importing Success Story of Diamond, a Japanese Publisher
VOL.36
2021.07 -
A Summer Trip with Books
VOL.36
2021.07 -
Naver and Kakao Compete Over Acquisition of Web-novel and Webtoon Platforms
VOL.36
2021.07 -
K-Book Copyright Fair Online
VOL.28
2020.11 -
Current status of each field in the Korean publishing market ⑩ Publication of Exam and College Books
VOL.28
2020.11 -
Uijeongbu
VOL.28
2020.11 -
Korean Children’s Books Going Global
VOL.28
2020.11 -
K-MUSIC
VOL.28
2020.11 -
How to Live in the Generation where You “Watch” Books
VOL.28
2020.11 -
Publication-Related Organizations in Korea
VOL.29
2020.12 -
Current status of each field in the Korean publishing market ⑪ Educational Publications (textbooks/reference books/home-study materials)
VOL.29
2020.12 -
Suncheon, Jeollanam-do
VOL.29
2020.12 -
Korean Literature in the European Publishing Market
VOL.29
2020.12 -
K-DRAMA
VOL.29
2020.12 -
Seoul International Book Fair 2020
VOL.29
2020.12 -
Overseas Publication Grants
VOL.30
2021.01 -
Current status of each field in the Korean publishing market ⑫ Publications of Children’s Books/Teenage Books
VOL.30
2021.01 -
Bucheon, Gyeonggi-do
VOL.30
2021.01 -
Performance Summary of Korean Publications in the Global Publishing Market in 2020 and Prospects for 2021
VOL.30
2021.01 -
K-WEBTOON & WEBNOVEL
VOL.30
2021.01 -
Status of the Korean Publishing Industry in 2020 and Outlook for 2021
VOL.30
2021.01 -
Tax & Accounting Issues in Korea’s Publishing Industry
VOL.31
2021.02 -
Korea’s Training Programs for Publishers Today and Tomorrow
VOL.31
2021.02 -
Haebangchon, Yongsan-gu, Seoul
VOL.31
2021.02 -
Export Cases of Language Books Developed in Korea
VOL.31
2021.02 -
K-Clothes Culture
VOL.31
2021.02 -
Bestseller Keyword - Money
VOL.31
2021.02 -
Bookstores that Create Books and Culture
VOL.32
2021.03 -
Introducing Korean Sci-Fi!
VOL.32
2021.03 -
K-Education
VOL.32
2021.03 -
Korea’s Audiobook Industry Ready to Fly in 2021
VOL.32
2021.03 -
Major Affairs in Korean Publishing Policy in 2021
VOL.32
2021.03 -
Cases of education materials developed and distributed for overseas Korean learners
VOL.32
2021.03 -
Bookstore Manager’s Pick: Books for Teens
VOL.35
2021.06 -
Daegu, Gyeongsangbuk-do
VOL.33
2021.04 -
Bookkeeper’s Choice - Picture Book
VOL.33
2021.04 -
K-Thriller
VOL.33
2021.04 -
Audiobooks in Korea: Users and Service Providers
VOL.33
2021.04 -
Popular Korean Webtoons in the US
VOL.33
2021.04 -
The “Contactless” Marketing Trend in the Era of COVID-19
VOL.33
2021.04 -
K-Book Promotion Grants Offered by KPIPA & LTI
VOL.33
2021.04 -
The Rise of Literary Agencies
VOL.35
2021.06 -
The Translation Academy of the LTI
VOL.35
2021.06 -
Ganghwa-gun, Incheon Metropolitan City
VOL.35
2021.06 -
Best Import Cases of Jiangsu Phoenix Education Publishing
VOL.35
2021.06 -
Picture Books with Lyrics
VOL.35
2021.06 -
Discussing the Current Status of Korean Picture Books
VOL.35
2021.06 -
The Standard Contracts for Publications
VOL.34
2021.05 -
Audiobooks: Issues and Future Developments
VOL.34
2021.05 -
National Library of Korea(NLK)’s Pick: Essay
VOL.34
2021.05 -
Subscription Models of Local Bookstores
VOL.34
2021.05 -
Kanki Publishing’s Successful Import Cases of Korean Books
VOL.34
2021.05 -
Books Written by Koreans Born and Living Overseas
VOL.34
2021.05 -
Best Book Designs From All Over The World
VOL.34
2021.05
Copyright© 2019 KIPIA. All Rights Reserved.


